
It should merely be irritating if it were not the case that billions upon billions of otherwise useful taxpayer dollars are being wasted chasing this concatenation of perceived slights against the reigning deity (Gaia) of the hair-triggered-inner-city-latte-sipping-limp-wristed-he/se/xe-watermelon unicorns who make up Australia's feudalistic 'elite'.
The weather soon returned to normal, but by then the doomsayers and their stenographers were off and running, yelping alarums to every sympathetic journalism-school graduate they could find. As demonstrated by today’s ABC headline, “Climate change: Scientists sad, frustrated as extreme weather becomes the new norm“, the usual suspects couldn’t have moved any faster toward the nearest microphone than if the visiting Michael “Hockey Stick” Mann was offering the hem of his garment for media slobbering.
As it happens, the press pack would have had to take a number and wait its turn, as Fairfax’s Peter Hannam was first in line — and seemingly determined not to mention anything negative about the jet-setting carbon-belcher’s dubious science, his involvement in Climategate, or the defamation action against Mark Steyn for branding a huckster and disgrace to science as exactly that. Deliciously, Hannam reported the author of so much fake news as being deeply troubled by … yes … “fake news.” You couldn’t make this stuff up, except that’s what their climate careerists and their toadies to every day of the week, twice on Sundays.
So forgive me, please, for being a little down in the mouth just at the moment, especially about the increasing tendency for alarmists (and their useful idiots in the MSM) to
employ vague hyperbole in reporting weather events, thus avoiding the inconvenient truth that such record temperatures as we have been setting lately are meaningless, being smaller than the margin of error.
By emotive hyperbole I mean, for example, words like ‘scorcher’ or ‘sizzler’ to describe days that, 30 years ago, would merely have been regarded as uncomfortably hot. The latest verbal trick I have noticed this summer is the term ‘heatwave conditions’ to refer to a single day above 35 degrees. We heard it constantly last week, as in:Residents of Australia’s East coast will suffer through scorching, “hell on earth” temperatures on Saturday as the full brunt of the lingering heatwave bites.............You might well react with an unimpressed shrug and dismissive ‘so what?’ If it was that hot 120 years ago, what’s so special about now? Alas, we know that such unquestioned media barracking is also part of the ongoing narrative, which features a constant barrage of subliminal CAGW propaganda. Sadly, many unthinking punters out there will buy it — otherwise they would be up in arms about electricity bills stupendously inflated by subsidies and market distortions intended to cripple reliable energy, coal and gas, in favour of wind and solar.
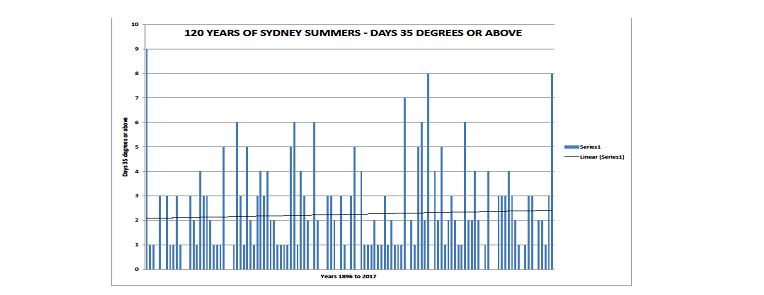
Anyway, I thought it might be instructive to look at the history of Sydney summers vis a vis the number of days 35C or over since 1896. After all, 1896 might be an outlier and 2017 the continuation of that Dreadful Heat’s (™) upward trend we keep hearing about but never seeing in the actual record, which has flat-lined for near on two decades, despite the climate establishment’s latest desperate bid to ginger up the numbers.
Here is a histogram based on BoM records:If the number of summer days above 35C demonstrated an CAGW signal, it is not apparent from the trend line shown above.
For example, summers with more than four days above 35C are common – 24 in this 120 year period and spread throughout the timeline. But only four have come in the last 25-odd years, the very period, we are told, of ‘ten of the hottest years on record’.
The other big story has been the record heatwave at Moree. As I write, Moree has recorded 47 days in a row above 35C, as the SMH put it “easily breaking the record of 17 consecutive days set in 1981/82.”
Even to a confirmed sceptic, such as myself, that sounds dire, seeming as if it is some of that ‘unprecedented warming’ has finally arrived, and arrived for good. Always ready to consider evidence that might prove me wrong, I decided to take a look at the historical record for Moree and what I found was very interesting. If you look at the BoM’s online long-term temperature record for Moree it only goes back as far as 1996. Not much help there, so I looked at ACORN.
ACORN is the Bureau’s official subset of 122 stations that forms the basis of our national temperature record – the data that gets shunted off to NOAA so that we can claim our rightful place in this catastrophically warming world. Moree is part of ACORN and its summary of stations shows Moree as having data back to 1910. However, when you open the datalink for Moree, it only goes back to 1957. With my limited resources I have not been able to find the data-set for Moree going back to 1910, if it exists. I wonder why not?
Anyway, I went through that data looking for long stretches over 35C. As it happens, 1957 provides the best example but unfortunately there is no data for December 1956. So let’s just look at January/Feb 1957. In that period, there were a total of 41 days exceeding 35C broken into stretches of 8 days, 16 days, 6 days and 11 days, these separated by three short periods of two or three days below 35C. Since the first ‘heatwave’ period started on the 1st of January, it’s entirely possible that the initial eight-day stretch may have been even longer, courtesy of December.
In practical terms, there is virtually no difference between what happened then what is happening this year. Interestingly, the January average for 1957 was 40.25, whereas for 2017 it was only 38.3. That may not seem meaningful but when ‘climatologists’ measure global temperature records in hundredths of a degree, well two can play at that game.
I must make a confession here. I took a small amount of licence in that I included any temperature over 34.7C (4 instances) as over 35C. Given that Moree is part of ACORN, it has undoubtedly been manipulated (sorry, homogenized) and if they can do it, why can’t I?
Why this preoccupation with days over 35C in places as disparate as Sydney and Moree? The reason is not hard to fathom: 35C is now the magic number the IPCC is using as a benchmark for ‘extreme weather’. The self-appointed Climate Council, under the stewardship of Tim “Empty Dams & Hot Rocks” Flannery, has issued a report, based on IPCC product, called Cranking up the Intensity: Climate Change and Extreme Weather Events.
Among its predictions are that the number of extremely hot days — classified as maximum temperatures of more than 35C — will climb in all capital cities. News.com.au’s Kim Stephens’ commenced her coverage of this report thus:IMAGINE a city where 265 days a year, the temperature rises above 35C.Other prognostications in the Climate Council report are that:
The residents of Darwin in 2090 will not have to imagine it, because for them, it may well be their reality.
As Australians endure the summer of the seemingly never-ending heatwave, a new report from the Climate Council essentially has one message.
Get used to it.
…in Sydney, the number of hot days (>35°C) per year are projected to increase from 3 to 4 per year by 2030 (relative to 1981-2010 climate), increasing to 11 per year by 2090, under a high emissions scenario (CSIRO and BoM 2015) from 11.
For Brisbane, the numbers are said to be going from 12 per year to 18 by 2030, and 55 per year by 2090. You get the picture.
Those ‘record’ years, such as 1896, 1957 and 2017, are climate outliers, not representative of the climate in general other than as manifestations of the fact that climate can throw up anomalous years for reasons that we only vaguely understand. They are not proof of ‘climate change’ or ‘global warming’ whether natural or man-made. Nor are they part of a trend, although no one is rushing to tell you that.
No comments:
Post a Comment